validation
Sensitivity and Error Budget
Because P(t) is a product, every factor has unit elasticity — a one-percent change in any factor changes the output by one percent. What distinguishes the factors is their uncertainty: a variance decomposition and error budget showing which term dominates.
A sensitivity analysis asks a sharp question: if one input moves, how much does the output move, and which input matters most? For the answer has an unusually clean structure, because the master equation is multiplicative. This chapter separates the two things a sensitivity analysis conflates — the response to a change and the contribution to uncertainty — and shows that for they behave very differently. It builds directly on the uncertainty analysis and shares its machinery with the reproducibility notebook.
Every factor has unit elasticity
Write the aggregated output schematically as a product of its factors, with . The elasticity of with respect to any factor — the fractional change in output per fractional change in input — is then exactly one:
A one-percent change in any single factor changes the output by one percent, no more and no less. First-order response is therefore uniform: no factor is intrinsically more “leveraged” than another. This is a genuine property of the multiplicative form, and it means the usual local-derivative ranking is uninformative here — it would rank all five factors equally.
What actually differs is the uncertainty
If the factors are not equally responsive, they are certainly not equally known. The useful sensitivity question for is therefore an error budget: how much of the uncertainty in the output does each factor contribute? Treating the factors as independent and log-normally distributed — the natural choice for quantities uncertain across an order of magnitude — the log-variances add:
so the fractional contribution of factor to the output variance is simply
The error budget is set entirely by the relative uncertainties , not by the values of the factors. This is the quantity worth ranking.
Error budget (illustrative)
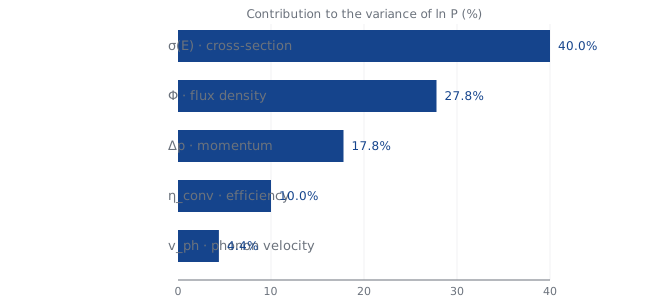
The table uses illustrative log-scale uncertainties — flagged as such, chosen to reflect that the neutrino cross-section is the least constrained term and the phonon velocity among the best constrained. Real values would come from measurement (measurement and falsifiability).
| Factor | Illustrative (ln units) | Variance share |
|---|---|---|
| — scattering cross-section | 0.6 | 40.0% |
| — radiation flux density | 0.5 | 27.8% |
| — momentum transfer | 0.4 | 17.8% |
| — conversion efficiency | 0.3 | 10.0% |
| — phonon velocity | 0.2 | 4.4% |
What the budget tells you
Two practical conclusions follow, and they are the reason the analysis is worth doing. First, measurement priority: because the cross-section term carries the largest share of the variance, an experimental programme reduces output uncertainty fastest by constraining first; halving its removes more of the total variance than halving any other. Second, where precision is wasted: tightening the phonon velocity, already the best-constrained term, barely moves the total. Combined with the unit-elasticity result, the picture is complete — every factor matters equally for the value of , but they matter very unequally for its uncertainty, and the error budget says exactly where to look. As with all numbers on this site, the here are illustrative; the method — decompose the log-variance, rank the shares, act on the largest — is the transferable content, and it is reproducible from the notebook.